PRODUCTS
SWOOP Analytics® for Viva Engage
Get more from Viva Engage by leveraging SWOOP’s collaboration analytics and transform the way your entire organisation gets work done.
AI-powered interactive coach helps you interpret and act on insights.
Viva Engage empowers every person in your organisation to have a voice and breaks down hierarchical barriers to connect all employees
The world of work has gone digital, and there’s no going back to the old way of doing things. Viva Engage is at the cutting edge of the next generation of digital collaboration tools, but you need the right analytical insights on your side to truly unlock your collaboration potential.
Watch SWOOP in action
SWOOP Analytics® provides you with 30+ metrics to gain a deep understanding about how your organisation is collaborating on Viva Engage, from the enterprise level all the way down to the individual.
Here’s how:
Personal metrics: SWOOP Analytics sits on top of your entire Viva Engage platform and gives every person in your organisation deep insights into how their collaboration and communication behaviour compares with others. Use this information to better understand your impact and identify opportunities for improvement.
Community metrics: Communities are the powerhouse of knowledge sharing. SWOOP Analytics enables you to set qualitative and quantitative goals, as well as gain valuable usage data, to understand how each community’s collaboration stacks up. Get insights into engagement, responsiveness, topic relevance and more.
Enterprise metrics: SWOOP Analytics provides a complete overview of collaboration metrics across your entire enterprise. Learn which areas and units in your business are the most (and least) engaged, and discover where there is a high level of cross-departmental collaboration.
SWOOP Analytics transforms the way you use Viva Engage
SWOOP Analytics provides organisations with comprehensive analytical insights about people’s activity on a Viva Engage. Armed with this information, leaders are better able to enhance the way their teams collaborate and unlock their potential as an organisation.
SWOOP delivers premium analytics without the premium price.
Measure two-way communications
Two-way communication is essential to have engaged employees and is a ‘must’ to ensure effective communication. SWOOP Analytics can show you a number of data points related to two-way relationships and cross-silo communication.
Cross-Enterprise Collaboration: This shows you the interactions occurring across segments of your organisation. You could segment by any attribute you have in your system i.e. department, office, country – and view it as a matrix or a map.
Two-way Relationships: This report shows you how many relationships are reciprocal. You can see a percentage overall value, or view it as a trend over time to track improvement/decline.
Know what works and what doesn’t work. Act at speed to improve.
Multiple reports within SWOOP Analytics will help you improve communications. Here are a few highlights beyond the obvious Most Engaging Posts and Hot Topics:
Impact of Attachments: see what difference it makes when you use different media (video, image, URL).
Sentiment Analysis: Use AI-powered sentiment analysis to spotlight conversations that need to be addressed.
Community Activity: See which communities are interacting the most and leverage that activity to amplify your communications.
Listening to the most important conversations
SWOOP Analytics for Viva Engage lets you jump straight into the conversations that matter in a couple of clicks.
Our Most Engaging Posts and Hot Topics reports let you go straight to the top content in your network.
This saves a substantial amount of time for corporate communications team members and individuals, especially leaders, who want to cut through the noise and hear what people are most interested in at any given moment.
Get deep insights into the level of interactions within your organisation
SWOOP Analytics can show you how many people are actively participating in knowledge sharing via Viva Engage.
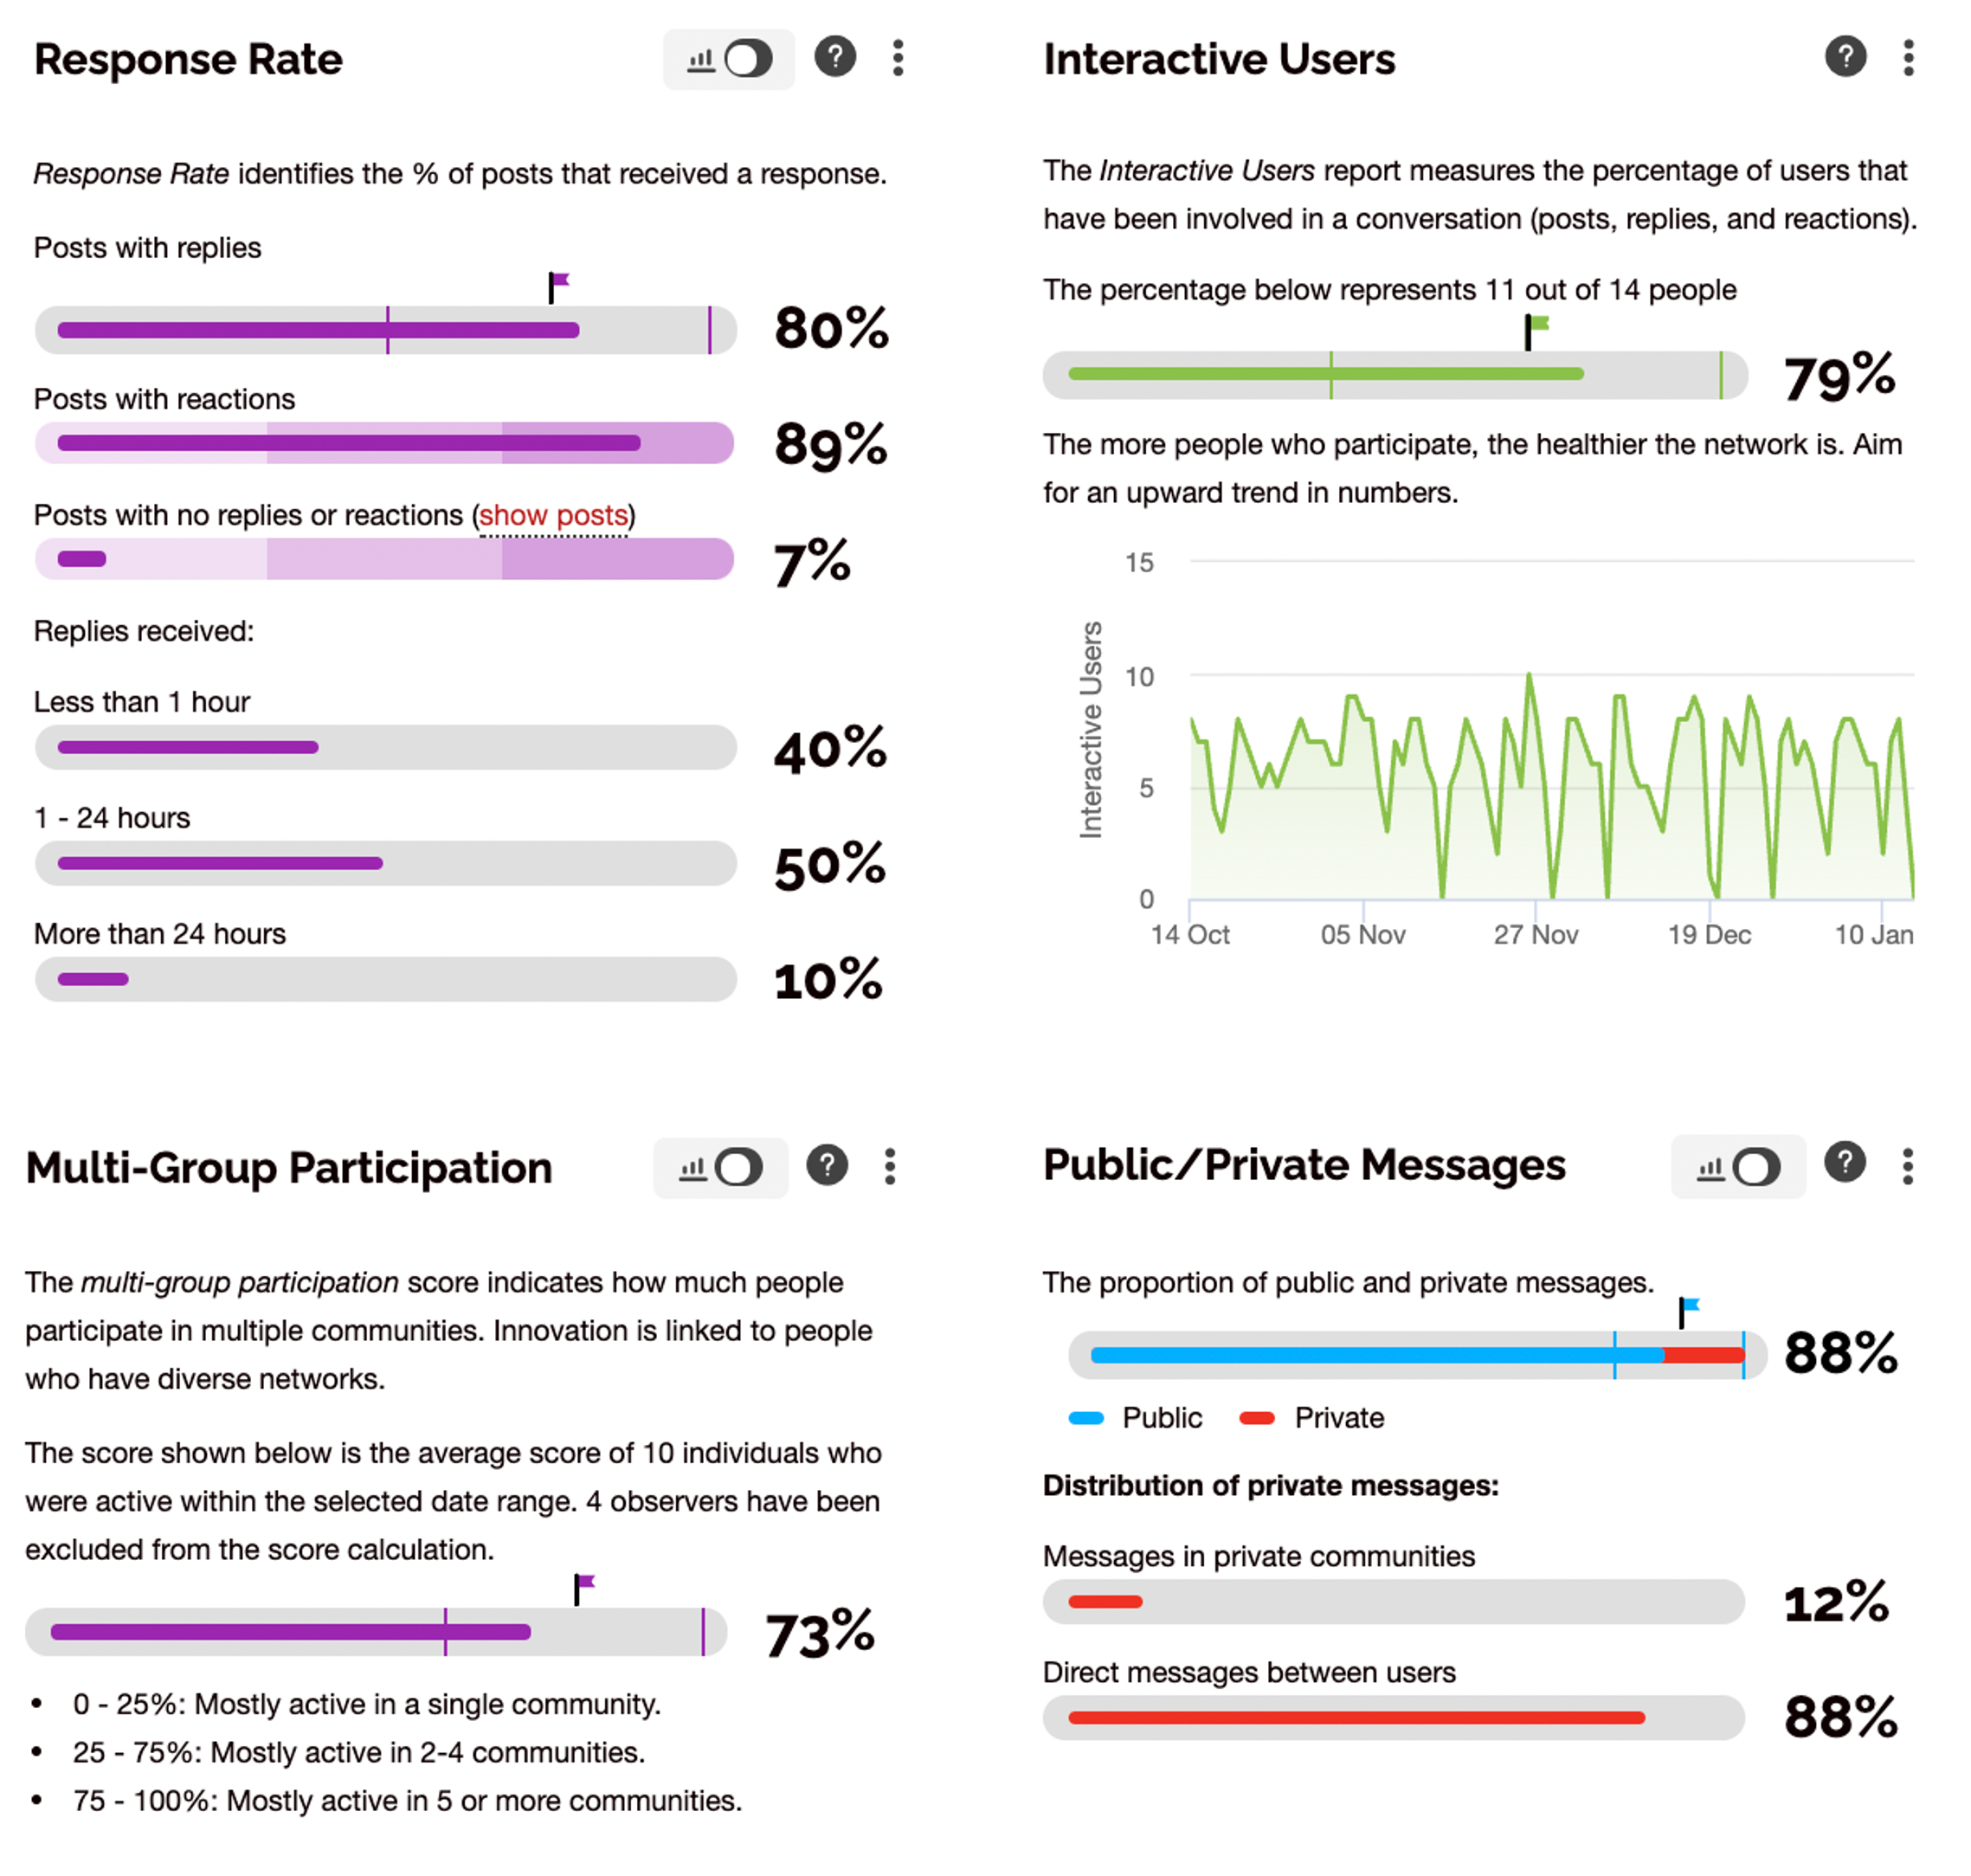
The Interactive Users report shows how many people have posted, replied, or reacted within Viva Engage and when they are active.
The Response Rate report shows you the responsiveness and speed of response within your network, showing the effectiveness of knowledge sharing at speed through this channel.
Multi-Group Participation tells you how active people are in multiple communities – showing diversity of knowledge sharing and cross-pollination of perspectives in action.
Public/Private Messages gives you an instant look into whether people are working openly or behind closed doors. Working out loud is a critical part of effective knowledge transfer.
Help leaders become better engagers
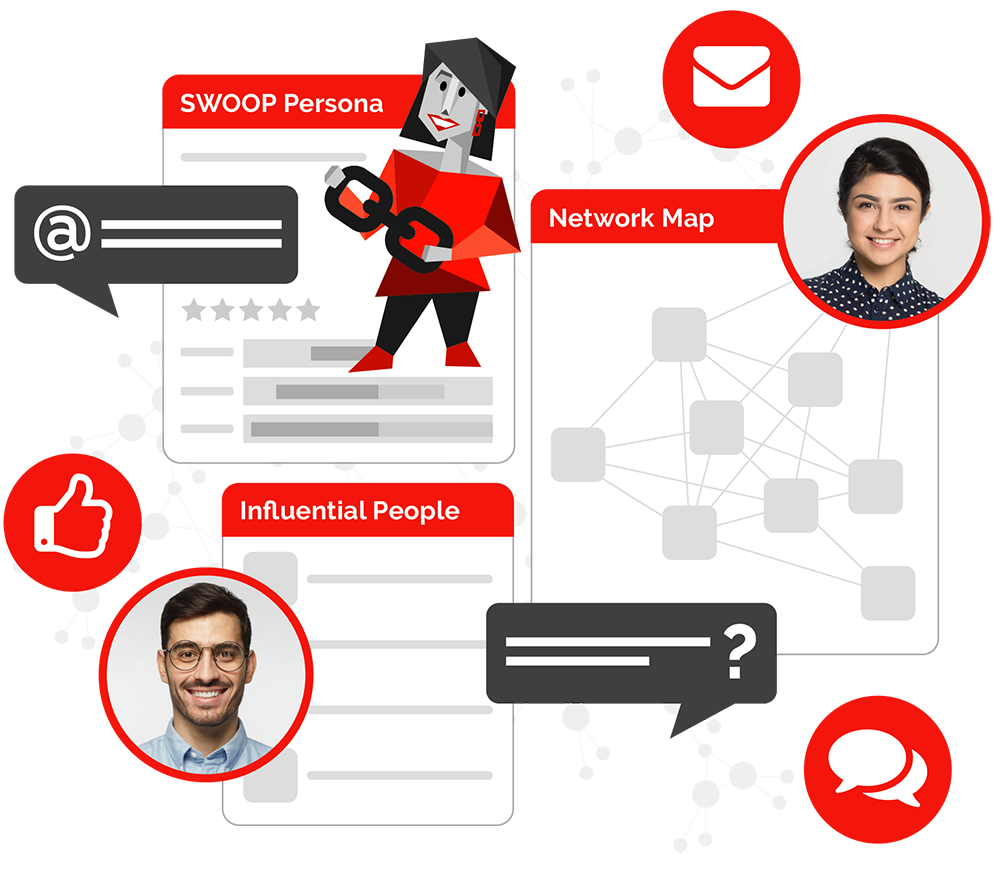
Using the SWOOP Personas you can help leaders adapt their behaviours to become more engaging in your community.
Our Benchmarking feature (only available to system admins) allows you to see in an instant how your leaders compare in terms of their engagement activity within Viva Engage.
The SWOOP Personas combined with the Benchmarking report become a fantastic tool to help leaders understand how they can change for the better. Using SWOOP Analytics, you can experiment with changes in behaviour and see the results in near-real-time.
SWOOP Analytics for Viva Engage v Microsoft OOTB analytics
|
For a post |
For a person |
For a topic |
For an audience |
For a community |
For the network |
||||||||
|
SWOOP |
MS |
SWOOP |
MS |
SWOOP |
MS |
SWOOP |
MS |
SWOOP |
MS |
SWOOP |
MS |
||
|
Activity |
Seen |
✔ |
✔ |
✔ |
|
✔ |
|
✔ |
|
✔ |
✔ |
✔ |
|
|
Activity by time |
✔ |
○ |
✔ |
|
✔ |
|
✔ |
|
✔ |
|
✔ |
| |
|
Community Activity |
|
|
✔ |
|
✔ |
|
✔ |
|
|
|
✔ |
|
|
|
Community Health |
|
|
|
|
|
|
|
|
✔ |
|
✔ |
|
|
|
Segment Activity |
✔ |
|
|
|
✔ |
|
|
|
✔ |
|
✔ |
|
|
|
Key Statistics |
✔ |
|
✔ |
|
✔ |
|
✔ |
|
✔ |
✔ |
✔ |
○ |
|
|
Active users |
|
|
|
|
|
|
✔ |
|
✔ |
✔ |
✔ |
|
|
|
User Activity |
✔ |
|
|
|
✔ |
|
✔ |
|
✔ |
|
✔ |
|
|
|
Engagement |
Curiosity |
|
|
✔ |
|
✔ |
|
✔ |
|
✔ |
|
✔ |
|
|
Influential People |
✔ |
|
|
|
✔ |
|
✔ |
|
✔ |
|
✔ |
|
|
|
Mentions |
|
|
✔ |
|
✔ |
|
✔ |
|
✔ |
|
✔ |
|
|
|
Nudges |
|
|
✔ |
|
|
|
|
|
|
|
|
|
|
|
Response Rate |
|
|
✔ |
|
✔ |
|
✔ |
|
✔ |
|
✔ |
|
|
|
Persona |
|
|
✔ |
|
|
|
|
|
|
|
|
|
|
|
Persona Distribution |
✔ |
|
|
|
✔ |
|
✔ |
|
✔ |
|
✔ |
|
|
|
Collaboration |
Collaboration Profile |
|
|
✔ |
|
|
|
✔ |
|
|
|
|
|
|
Multi-Group Participation |
|
|
✔ |
|
|
|
✔ |
|
✔ |
|
✔ |
|
|
|
Network Map |
✔ |
|
✔ |
|
✔ |
|
✔ |
|
✔ |
|
✔ |
|
|
|
Two-Way Relationships |
✔ |
|
✔ |
|
✔ |
|
✔ |
|
✔ |
|
✔ |
|
|
|
Content |
Impact of Attachments |
✔ |
|
✔ |
|
✔ |
|
✔ |
|
✔ |
|
✔ |
|
|
Keywords |
✔ |
|
✔ |
|
✔ |
|
✔ |
|
✔ |
|
✔ |
|
|
|
Hot Topics |
|
|
|
|
|
|
✔ |
|
✔ |
|
✔ |
○ |
|
|
Most Engaging Posts |
✔ |
|
✔ |
|
✔ |
|
✔ |
|
✔ |
|
✔ |
|
|
|
Public / Private Messages |
|
|
✔ |
|
✔ |
|
✔ |
|
|
|
✔ |
|
|
|
Sentiment Analysis |
✔ |
✔ |
|
|
✔ |
|
✔ |
|
✔ |
|
✔ |
|
|
|
Sentiment by Time |
✔ |
|
✔ |
|
✔ |
|
✔ |
|
✔ |
|
✔ |
|
|
|
Functionality |
Benchmarking |
|
|
✔ |
|
✔ |
|
✔ |
|
✔ |
|
|
|
|
Comparisons |
✔ |
|
✔ |
|
✔ |
|
✔ |
|
✔ |
|
✔ |
|
|
|
Custom Date Range |
✔ |
|
✔ |
|
✔ |
|
✔ |
|
✔ |
|
✔ |
|
|
|
Access |
✔ |
✔ |
✔ |
|
✔ |
|
✔ |
|
✔ |
✔ |
✔ |
|
|

