PRODUCTS
SWOOP Analytics®
for Workplace from Meta
Workplace from Meta is closing down on September 1, 2025, and until then, SWOOP Analytics for Workplace will be fully operational.
Workplace Timeline:
Until August 31, 2025:
Continue using Workplace
as usual.
September 1, 2025
- May 31, 2026:
Read and download
existing data.
June 1, 2026:
Access terminated and your Workplace deleted.
Transition from Workplace to Viva Engage
with SWOOP Analytics
Between now and September 1, 2025, we want to help you migrate to Viva Engage.
We are offering access to both SWOOP Analytics for Workplace and SWOOP Analytics for Viva Engage
for up to 12 months for the same subscription fee.
This allows you to continue to have full access to SWOOP Analytics for Workplace as you make the transition to Viva Engage, and all the while you’ll also have complete access to SWOOP Analytics for Viva Engage at no extra cost. You’ll be able to see exactly how the migration is being embraced across your organisation, you’ll see which influencers to target to help with the transition, and you’ll understand the health of your communities.
If you’re still undecided about which platform to transition to, SWOOP Analytics CEO Cai Kjaer has outlined the options available. We’ve also done the analysis, based on years of data, to find out if Viva Engage is as good as Workplace.
The data tells us that Viva Engage is just as effective as Workplace from Meta, if not better, at connecting people and allowing communication to flow.
The Great Migration:
Practical steps for a seamless transition from Workplace to
Viva Engage
It's not an easy decision for those forced to leave Workplace and find another enterprise social network. Let's look at this forced change as an opportunity to reflect on what we really want to get out of an ESN, and start fresh on Viva Engage.
In this webinar, Jessica Tesoriero from HOYTS Group shares her first hand experience migrating from Workplace to Viva Engage. 89% of HOYTS' workforce are frontline workers, so having an ESN is vital, and Jess speaks about using the migration from Workplace to Viva Engage as a chance to make a fresh start and, along with Andrew Polydorou from Engage Squared, shares details about the logistics of a successful migration.
Angus Florance from Microsoft gives a great overview of what you can expect in Viva Engage and Cai Kjaer from SWOOP Analytics shares a comparison of Workplace and Viva Engage, so you can see how the two platforms really stack up, and learn how you can tap into the data to ensure a seamless transition from Workplace to Viva Engage.
Helping you decide:
Data-driven comparison of Workplace vs Viva Engage
In the table below we have outlined a set of metrics and scores that are based on analysing millions of interactions users have performed on Workplace and Viva Engage. And we have outlined what business outcome they relate to.
| Metric | Business Outcomes | Workplace Score | Viva Engage Score | Verdict |
|---|---|---|---|---|
|
Replies to Posts Percentage of posts with a reply. |
More replies to posts can encourage active discussions and knowledge sharing, leading to a more informed and engaged workforce. This can improve decision-making and innovation. |
46.5% |
47% |
It's a tie. Too close to call. |
|
Two-Way Relationships Percentage of relationships that are two-way. |
Strong, reciprocal relationships can lead to a more cohesive and collaborative work environment. This can improve information flow, decision-making, and overall business performance. |
17% |
21.1% |
Viva Engage is slightly ahead. |
|
Influencer Risk Score Indicates the risk of over-reliance on a few key influencers. |
A lower influencer risk score can reduce the risk of over-reliance on a few individuals, leading to a more resilient and distributed network. This can improve business continuity and reduce key-person risk. |
34.1 |
33.9 |
It's a tie. Too close to call. |
|
Public Messages The percentage of messages posted publicly. |
Public messages can encourage transparency and open communication, fostering a culture of trust and accountability. This can improve employee morale and business integrity. |
60.7% |
79.6% |
Viva Engage is ahead. |
|
Curiosity Index The percentage of posts and replies that include a question. |
A higher Curiosity Index can foster a culture of curiosity and innovation, leading to more creative solutions and continuous learning. This can improve business adaptability and competitiveness. |
8% |
12.8% |
Viva Engage is ahead. |
|
Active Users Percent The percentage of users who are actively contributing. |
A higher percentage of active users can indicate successful platform adoption and engagement, leading to more effective use of the platform for collaboration and communication. This can improve business efficiency and effectiveness. |
35.2% |
31.3% |
Workplace is slightly ahead. |
|
Activity Per User The average number of interactions per user. |
More activity per user (posts, replies, reactions) can encourage active participation and engagement, leading to a more vibrant and collaborative work environment. This can improve employee satisfaction and productivity. |
19.8 |
24.7 |
Viva Engage is slightly ahead. |
|
Multi-Group Participation Measures users being active in multiple groups. |
More multi-group participation can promote the diversity of ideas and cross-pollination, leading to more innovative solutions and a broader understanding of the business. |
47.8 |
44.4 |
Workplace is slightly ahead. |
The comparison table above demonstrates that the two platforms can deliver similar business outcomes. In most cases, the differences are insignificant. However, two areas stand out. The proportion of messages posted in public communities is higher on Viva Engage than Workplace, and the proportion of messages which include a question (Curiosity Index) is also higher on Viva Engage.
Public Messages = Transparency = Knowledge-sharing
Transparency and knowledge-sharing go hand in hand. On Viva Engage, employees are better at connecting with colleagues across organisational, functional and geographical boundaries in open forums. This allows for more cross-pollination of ideas, and less of “if only we knew what we know”.
Also, our benchmarking on Viva Engage and Microsoft Teams has clearly shown communities on Viva Engage are mostly large and open, whereas teams on Microsoft Teams are smaller and private. If you are moving to Viva Engage, you can therefore expect that some of your colleagues will opt for Microsoft Teams, leaving Viva Engage for broader and more public conversations.
Asking questions = Trust = Speed
Another encouraging outcome those moving to Viva Engage can expect is that more questions will be asked. When we ask questions, it is a sign of trust. In low trust cultures people don’t ask questions. It is a sign of weakness, or something employees have learned is not encouraged. Trust is closely related to how fast you can move as a business. High trust = High speed.
A move to Viva Engage seems like a no-brainer
Had it not been for the fact that Workplace has decided to close, it might be less straightforward to recommend a move to Viva Engage. While there might have been cost savings, technology optimisation or similar benefits associated with a move, it seems both platforms have successfully enabled strong business outcomes.
However, given that Workplace is going away, and that Viva Engage is performing better, a move to Viva Engage seems like a no-brainer.
How SWOOP Analytics can help as you migrate to Viva Engage
We’re going to assume that you have decided to move to Viva Engage, and we suggest you consider using SWOOP Analytics for Workplace and SWOOP Analytics for Viva Engage to help.
Understanding
the landscape
Planning the migration
Preparing for
the change
Executing the migration
Monitoring
post-migration
Continuous improvement
Before embarking on this journey, it's crucial to understand the current state of your Workplace site. Using SWOOP Analytics for Workplace, you can gain insights into how your organisation is collaborating, identify key influencers, and understand the health of your communities. This will provide a solid foundation for your migration plan.
With a clear understanding of your current landscape, you can begin to plan your migration. You can identify which groups and content need to be migrated to Viva Engage. Prioritise based on activity levels, business criticality, and the readiness of the group members for the change.
Within SWOOP Analytics for Viva Engage, you can see the most Influential People across each department, segment, or across the enterprise. Change can be daunting, but with the right preparation, it can be managed effectively. Use the insights from SWOOP Analytics to identify key influencers who can act as change champions. Develop a communications plan to keep everyone informed about the migration process and the benefits of moving to Viva Engage.
With a plan in place and your organisation prepared for the change, you can begin the migration process. This will involve technical tasks such as setting up your Viva Engage environment, migrating content, and configuring settings. Remember to test thoroughly before going live.
Once you've migrated to Viva Engage, use SWOOP Analytics for Viva Engage to monitor the health of your new digital environment. Track key metrics such as engagement, responsiveness, and cross-departmental collaboration. Use these insights to identify areas for improvement and celebrate successes.
The journey doesn't end with migration. Continually monitor your Viva Engage environment with SWOOP Analytics, and use the insights to drive ongoing improvements.
SWOOP Analytics transforms the way you use Workplace
SWOOP Analytics provides organisations with comprehensive analytical insights about communication and engagement on Workplace. Armed with this information, leaders are better able to enhance the way their people interact and unlock their potential as an organisation.
Measure two-way communications
Two-way communication is essential to have engaged employees and to ensure effective conversations. SWOOP Analytics can show you a number of data points related to two-way relationships and cross-silo communication.
Enterprise Collaboration: This feature displays the interactions occurring across different segments of your organization. You have the ability to segment by any attribute available in your system, such as department, office, or country. These interactions can be viewed as either a matrix or a map, providing a comprehensive overview of collaborative efforts.
Two-way Relationships: This feature informs you about the number of reciprocal relationships within your organization. It provides a percentage value that represents the overall reciprocality, or you can choose to view it as a trend over time to track improvements or declines.
Know what works and what doesn’t work. Act at speed to improve.
Multiple reports within SWOOP Analytics will help you improve communications. Here are a few highlights beyond the obvious Most Engaging Posts and Hot Topics:
Impact of Attachments: see what difference it makes when you use different media (video, image, URL).
Sentiment Analysis: Use AI-powered sentiment analysis to spotlight conversations that need to be addressed.
Group Activity: See which groups are interacting the most and leverage that activity to amplify your communications.
Listening to the most important conversations
SWOOP Analytics for Workplace lets you jump straight into the conversations that matter in a couple of clicks.
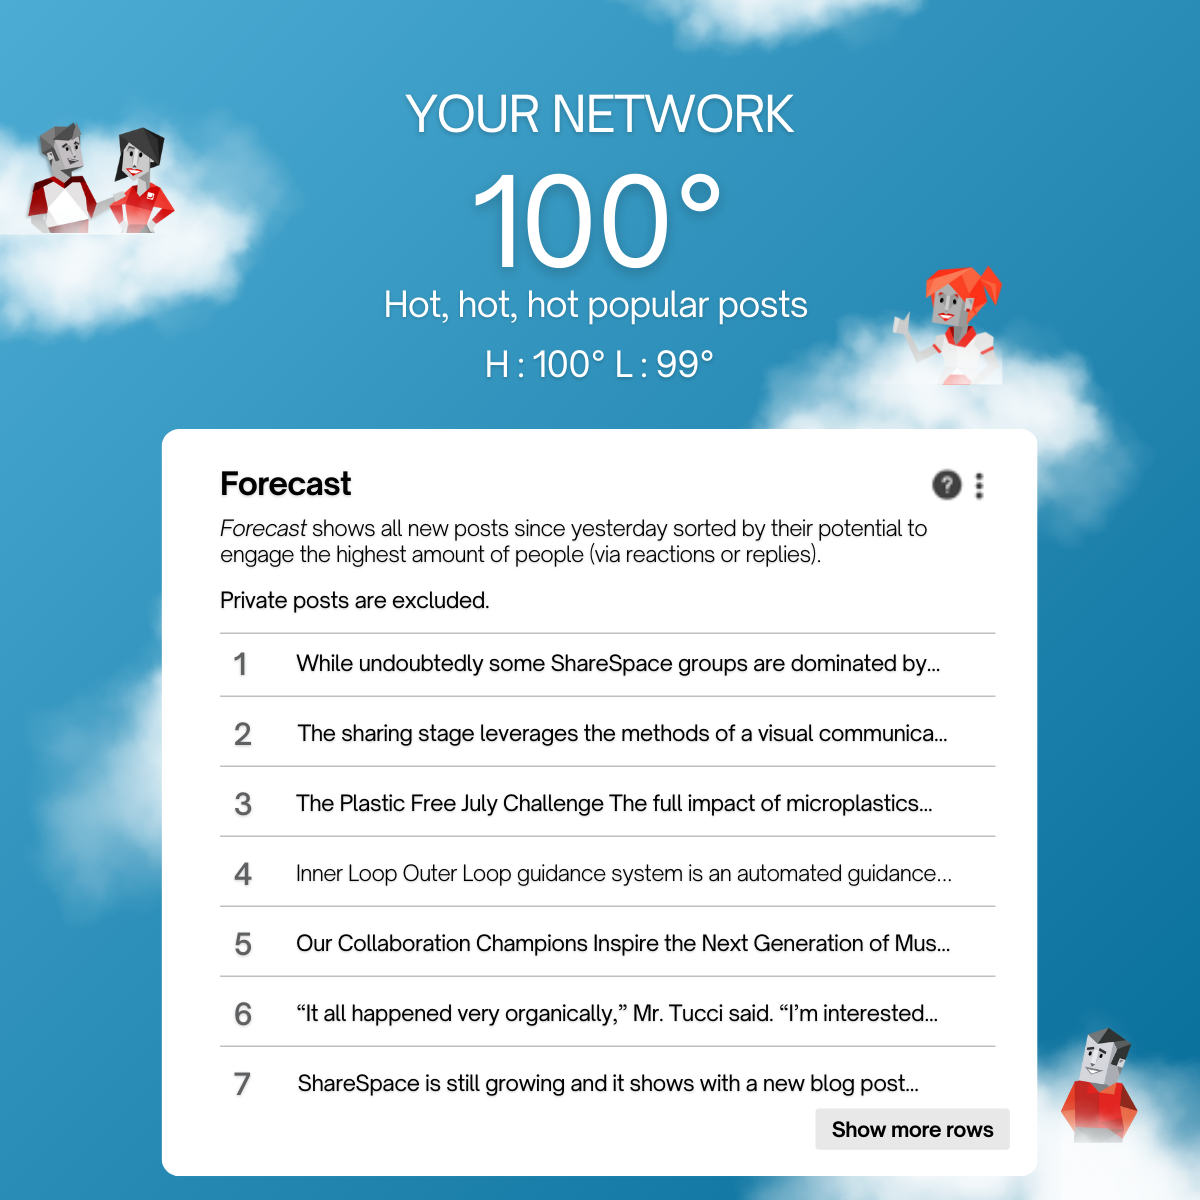
Our Most Engaging Posts and Hot Topics reports let you go straight to the top content in your network.
This saves a substantial amount of time for corporate communication team members and individuals, especially leaders, who want to cut through the noise and hear what people are most interested in at any given moment.
Get deep insights into the level of interactions within your organisation
SWOOP Analytics can show you how many people are actively participating in knowledge sharing via Workplace.
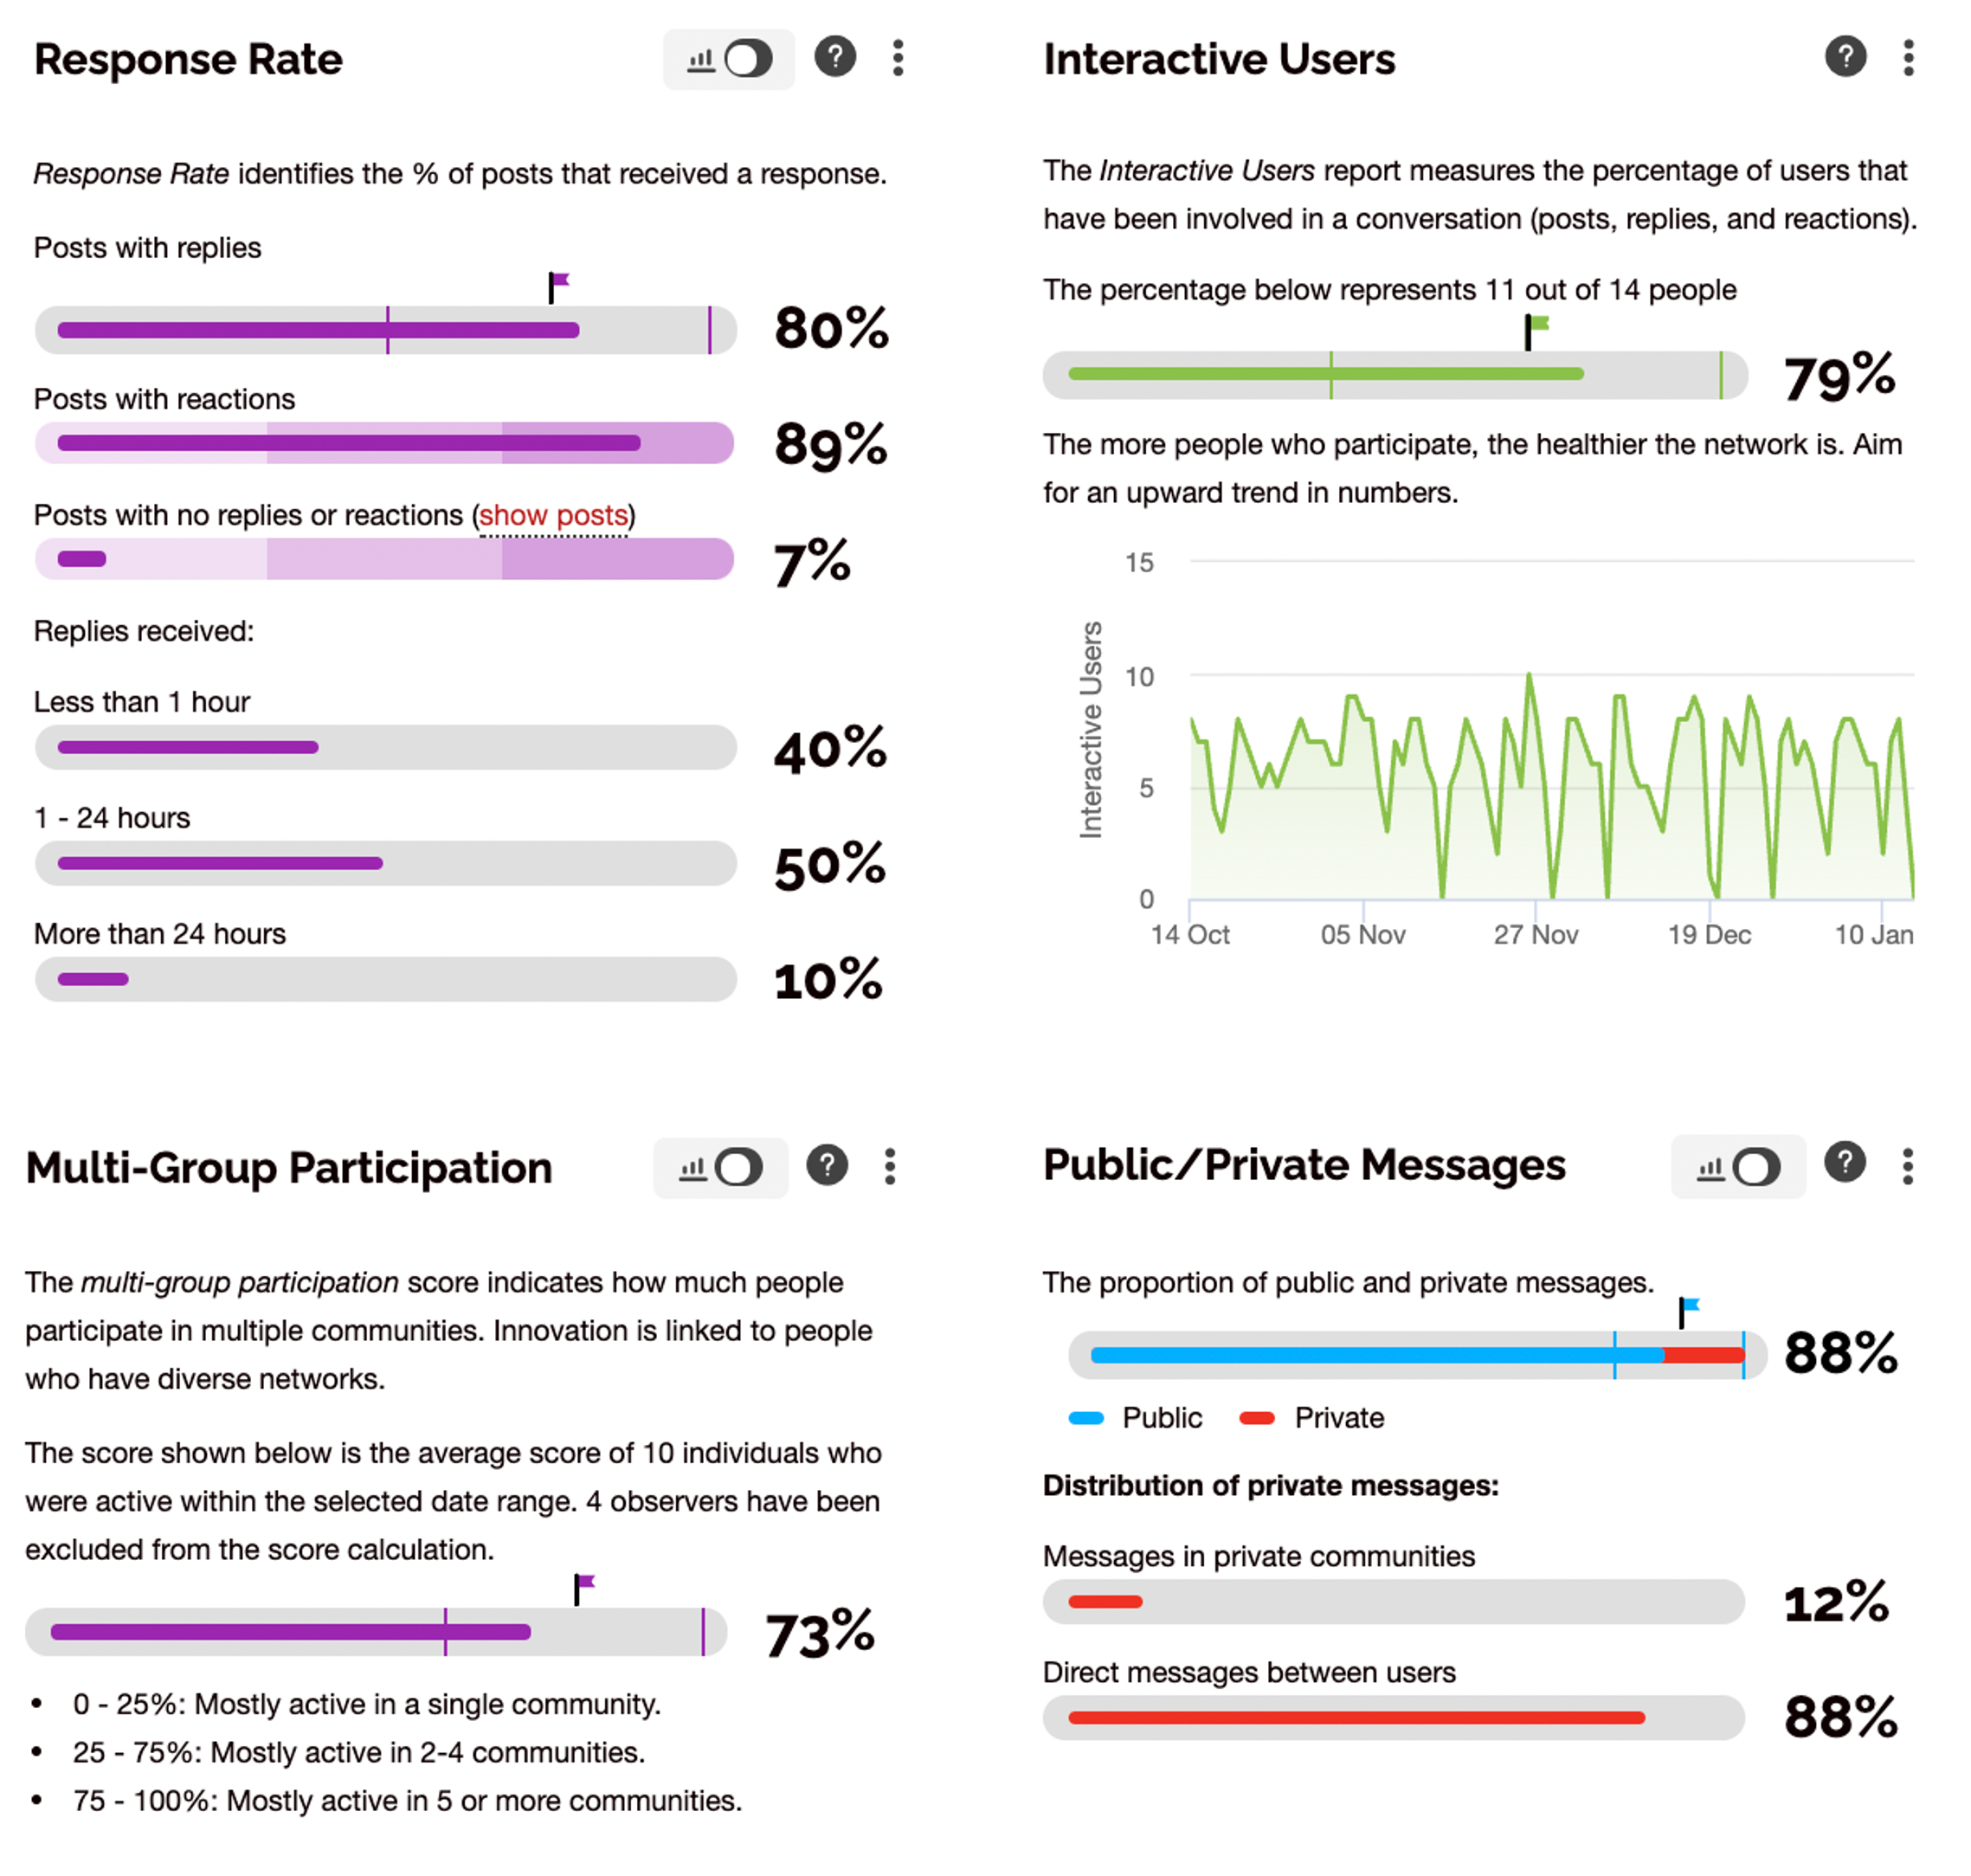
The Interactive Users report shows how many people have posted, replied, or reacted within Workplace and when they are active.
The Response Rate report shows you the responsiveness and speed of response within your network, showing the effectiveness of knowledge sharing at speed through this channel.
Multi-Group Participation tells you how active people are in multiple groups – showing diversity of knowledge sharing and cross-pollination of perspectives in action.
Public/Private Messages gives you an instant look into whether people are working openly or behind closed doors. Working out loud is a critical part of effective knowledge transfer.
Help leaders become better engagers
Using the SWOOP Personas you can help leaders adapt their behaviours to become more engaging in your group.
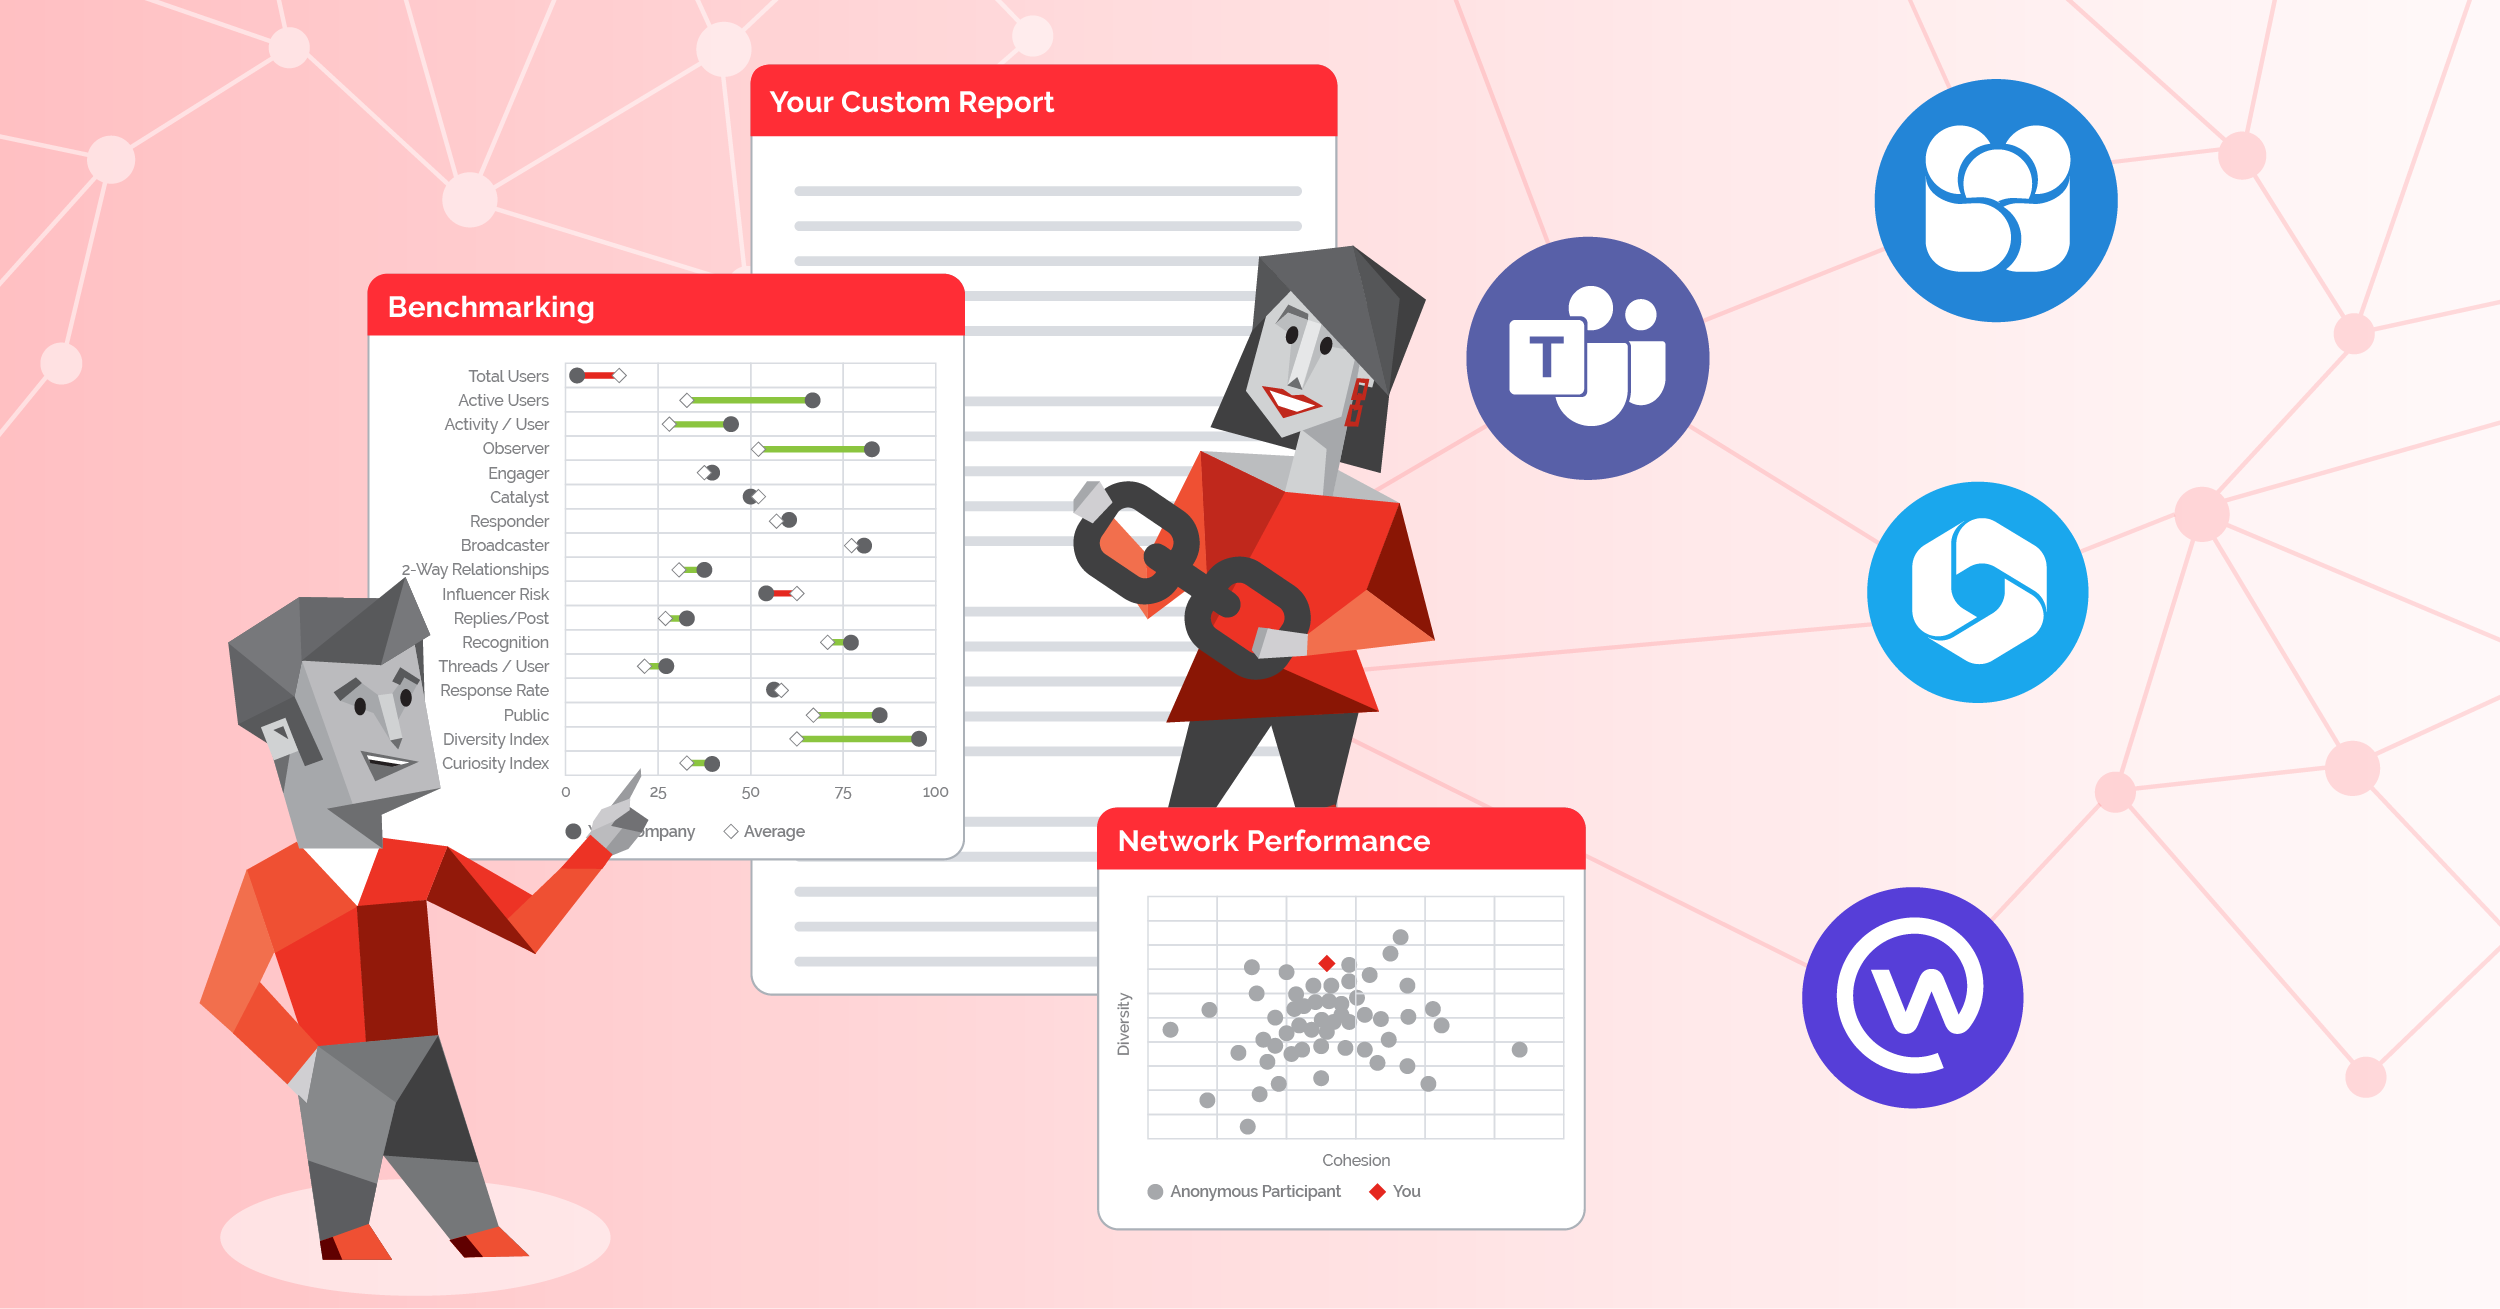
Our Benchmarking feature (only available to system admins) allows you to see in an instant how your leaders compare in terms of their engagement activity within Workplace.
The SWOOP Personas combined with the Benchmarking report become a fantastic tool to help leaders understand how they can change for the better. Using SWOOP Analytics, you can experiment with changes in behaviour and see the results in near-real-time.


